Part 1
요약·해설
CLion 설치와 workspace trust, MinGW·virtual environment·board profile, debug Kconfig, RTOS integration, J-Link GDB Server 표와 task debug 절차를 설명합니다.
CMake · board · zephyr_final
RTOS integration · GDB
Segger J-Link
Part 2
접을 수 있는 영어 원문 전체
영어 원문 전체 펼치기
3FA075747FAD5579D1F175A922F1B4B2075EDFF7F495FF959878DD24F1B62906
.. _clion_ide:

CLion
#####

CLion_ is a cross-platform C/C++ IDE that supports multi-threaded RTOS debugging.

This guide describes the process of setting up, building, and debugging Zephyr's
:zephyr:code-sample:`multi-thread-blinky` sample in CLion.

The instructions have been tested on Windows. In terms of the CLion workflow, the steps would be the
same for macOS and Linux, but make sure to select the correct environment file and to adjust the
paths.

Get CLion
*********

`Download CLion`_ and install it.

Initialize a new workspace
**************************

This guide gives details on how to build and debug the :zephyr:code-sample:`multi-thread-blinky`
sample application, but the instructions would be similar for any Zephyr project and :ref:`workspace
layout <west-workspaces>`.

Before you start, make sure you have a working Zephyr development environment, as per the
instructions in the :ref:`getting_started`.

Open the project in CLion
**************************

#. In CLion, click :guilabel:`Open` on the Welcome screen or select :menuselection:`File --> Open`
   from the main menu.

#. Navigate to your Zephyr workspace (i.e.the :file:`zephyrproject` folder in your HOME directory if
   you have followed the Getting Started instructions), then select
   :file:`zephyr/samples/basic/threads` or another sample project folder.

   Click :guilabel:`OK`.

#. If prompted, click :guilabel:`Trust Project`.

   See the `Project security`_ section in CLion web help for more information on project security.

Configure the toolchain and CMake profile
*****************************************

CLion will open the :guilabel:`Open Project Wizard` with the CMake profile settings. If that does
not happen, go to :menuselection:`Settings --> Build, Execution, Deployment --> CMake`.

#. Click :guilabel:`Manage Toolchains` next to the :guilabel:`Toolchain` field. This will open the
   :guilabel:`Toolchain` settings dialog.

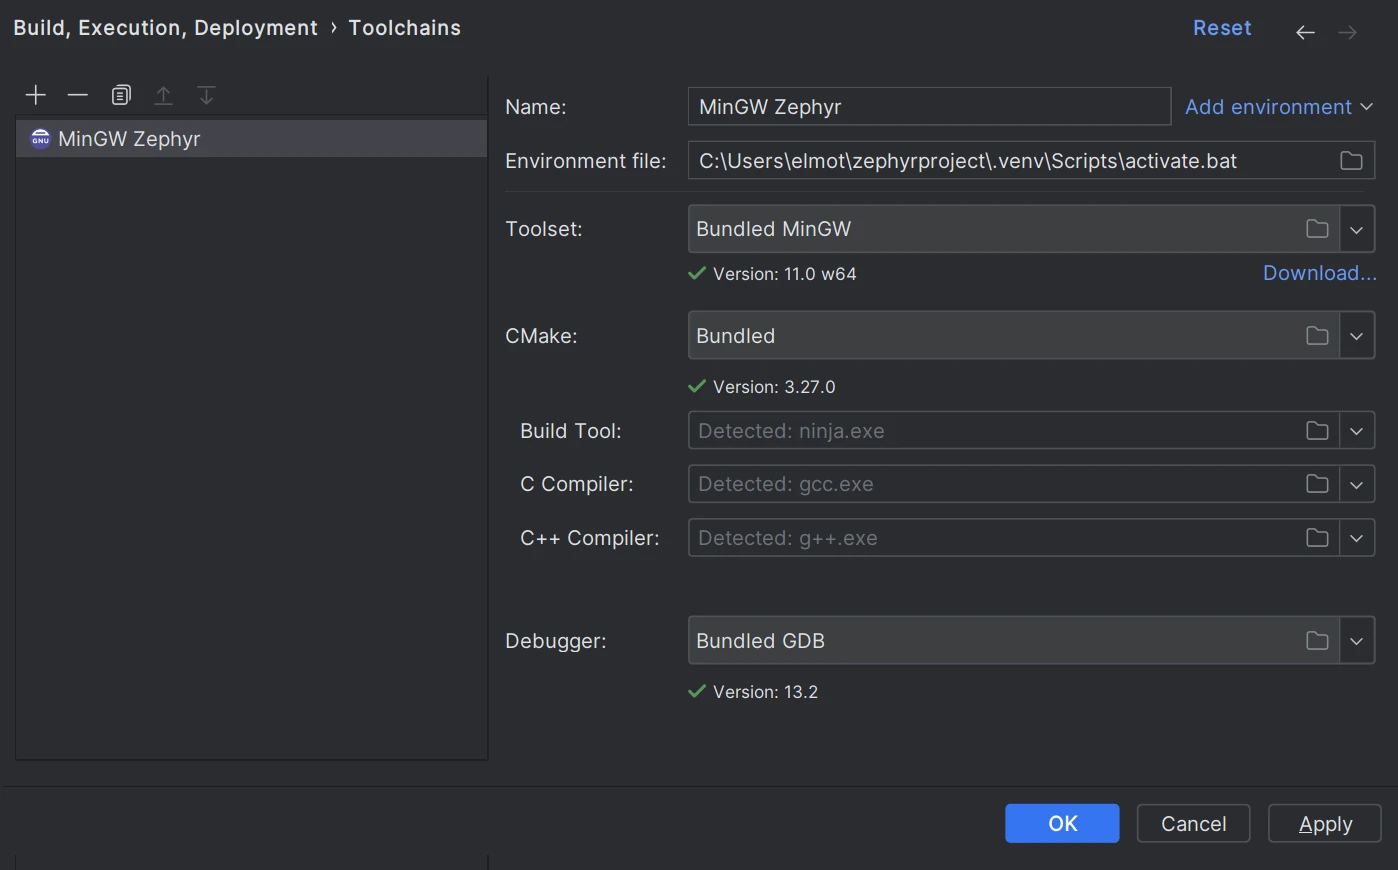
#. We recommend that you use the :guilabel:`Bundled MinGW` toolchain with default settings on
   Windows, or the :guilabel:`System` (default) toolchain on Unix machines.

#. Click :menuselection:`Add environment --> From file` and select
   ``..\.venv\Scripts\activate.bat``.

   .. figure:: ../../../../develop/tools/img/clion_toolchain_mingw.webp
      :width: 600px
      :align: center
      :alt: MinGW toolchain with environment script

   Click :guilabel:`Apply` to save the changes.

#. Back in the CMake profile settings dialog, specify your board in the :guilabel:`CMake options`
   field. For example:

   .. code-block::

      -DBOARD=nrf52840dk/nrf52840

   .. figure:: ../../../../develop/tools/img/clion_cmakeprofile.webp
      :width: 600px
      :align: center
      :alt: CMake profile

#. Click :guilabel:`Apply` to save the changes.

   CMake load should finish successfully.

Configure Zephyr parameters for debug
*************************************

#. In the configuration switcher on the top right, select :guilabel:`guiconfig` and click the hammer
   icon.

#. Use the GUI application to set the following flags:

   .. code-block::

      DEBUG_THREAD_INFO
      THREAD_RUNTIME_STATS
      DEBUG_OPTIMIZATIONS

Build the project
*****************

In the configuration switcher, select **zephyr_final** and click the hammer icon.

Note that other CMake targets like ``puncover`` or ``hardenconfig`` can also be called at this
point.


Enable RTOS integration
***********************

#. Go to :menuselection:`Settings --> Build, Execution, Deployment --> Embedded Development --> RTOS
   Integration`.

#. Set the :guilabel:`Enable RTOS Integration` checkbox.

   This option enables Zephyr tasks view during debugging. See `Multi-threaded RTOS debug`_ in CLion
   web help for more information.

   You can leave the option set to :guilabel:`Auto`. CLion will detect Zephyr automatically.

Create an Embedded GDB Server configuration
*******************************************

In order to debug a Zephyr application in CLion, you need to create a run/debug configuration out of
the Embedded GDB Server template.

Instructions below show the case of a Nordic Semiconductor board and a Segger J-Link debug probe. If
your setup is different, make sure to adjust the configuration settings accordingly.

#. Select :menuselection:`Run --> New Embedded Configuration` from the main menu.

#. Configure the settings:

    .. list-table::
        :header-rows: 1

        * - Option
          - Value

        * - :guilabel:`Name` (optional)
          - Zephyr-threads

        * - :guilabel:`GDB Server Type`
          - Segger JLink

        * - :guilabel:`Location`
          - The path to ``JLinkGDBServerCL.exe`` on Windows or the ``JLinkGDBServer`` binary on
            macOS/Linux.

        * - :guilabel:`Debugger`
          - Bundled GDB

            .. note:: For non-ARM and non-x86 architectures, use a GDB executable
               from Zephyr SDK. Make sure to pick a version with Python support
               (for example, **riscv64-zephyr-elf-gdb-py**) and check that Python
               is present in the system ``PATH``.

        * - :guilabel:`Target`
          - zephyr-final

        * - :guilabel:`Executable binary`
          - zephyr-final

        * - :guilabel:`Download binary`
          - Always

        * - :guilabel:`TCP/IP port`
          - Auto

    .. figure:: ../../../../develop/tools/img/clion_gdbserverconfig.webp
       :width: 500px
       :align: center
       :alt: Embedded GDB server configuration

#. Click :guilabel:`Next` to set the Segger J-Link parameters.

    .. figure:: ../../../../develop/tools/img/clion_segger_settings.webp
       :width: 500px
       :align: center
       :alt: Segger J-Link parameters

#. Click :guilabel:`Create` when ready.

Start debugging
***************

#. Place breakpoints by clicking in the left gutter next to the code lines.

#. Make sure that **Zephyr-threads** is selected in the configuration switcher and click the bug
   icon or press :kbd:`Ctrl+D`.

#. When a breakpoint is hit, CLion opens the Debug tool window.

   Zephyr tasks are listed in the :guilabel:`Threads & Variables` pane. You can switch between them
   and inspect the variables for each task.

    .. figure:: ../../../../develop/tools/img/clion_debug_threads.webp
       :width: 800px
       :align: center
       :alt: Viewing Zephyr tasks during a debug session

   Refer to `CLion web help`_ for detailed description of the IDE debug capabilities.

.. _CLion: https://www.jetbrains.com/clion/
.. _Download CLion: https://www.jetbrains.com/clion/download
.. _Project security: https://www.jetbrains.com/help/clion/project-security.html#projects_security
.. _Multi-threaded RTOS debug: https://www.jetbrains.com/help/clion/rtos-debug.html
.. _CLion web help: https://www.jetbrains.com/help/clion/debugging-code.html
Part 3
한국어 전문 번역
CLion
CLion은 multi-threaded RTOS debugging을 지원하는 cross-platform C/C++ IDE입니다.
이 안내는 CLion에서 Zephyr multi-thread-blinky sample을 설정·build·debug하는 과정을 설명합니다. Windows에서 검증되었으며 CLion workflow는 macOS와 Linux에서도 같지만 운영체제에 맞는 environment file과 path를 선택해야 합니다.
CLion 받기
CLion download 페이지에서 installer를 받아 설치합니다.
새 workspace 초기화
예시는 multi-thread blinky지만 다른 Zephyr project와 West workspace layout에도 같은 흐름을 적용할 수 있습니다. 시작 전에 Getting Started에 따라 동작하는 Zephyr 개발 환경을 준비합니다.
CLion에서 project 열기
- Welcome 화면에서 Open을 누르거나 main menu의 File → Open을 선택합니다.
zephyrproject같은 Zephyr workspace로 이동한 뒤zephyr/samples/basic/threads또는 다른 sample project folder를 선택하고 OK를 누릅니다.- 확인창이 나오면 Trust Project를 누릅니다. 보안 의미는 CLion Project security에서 확인합니다.
Toolchain과 CMake profile 구성
Project를 열면 CLion이 CMake profile을 설정하는 Open Project Wizard를 표시합니다. 표시되지 않으면 Settings → Build, Execution, Deployment → CMake로 이동합니다.
- Toolchain field 옆의 Manage Toolchains를 눌러 Toolchain settings dialog를 엽니다.
- Windows에서는 기본 설정의 Bundled MinGW, Unix에서는 System(default) toolchain을 권장합니다.
Add environment → From file을 선택하고..\.venv\Scripts\activate.bat를 지정한 뒤 Apply를 누릅니다.
CMake profile settings로 돌아가 CMake options에 board를 지정합니다. 예:
-DBOARD=nrf52840dk/nrf52840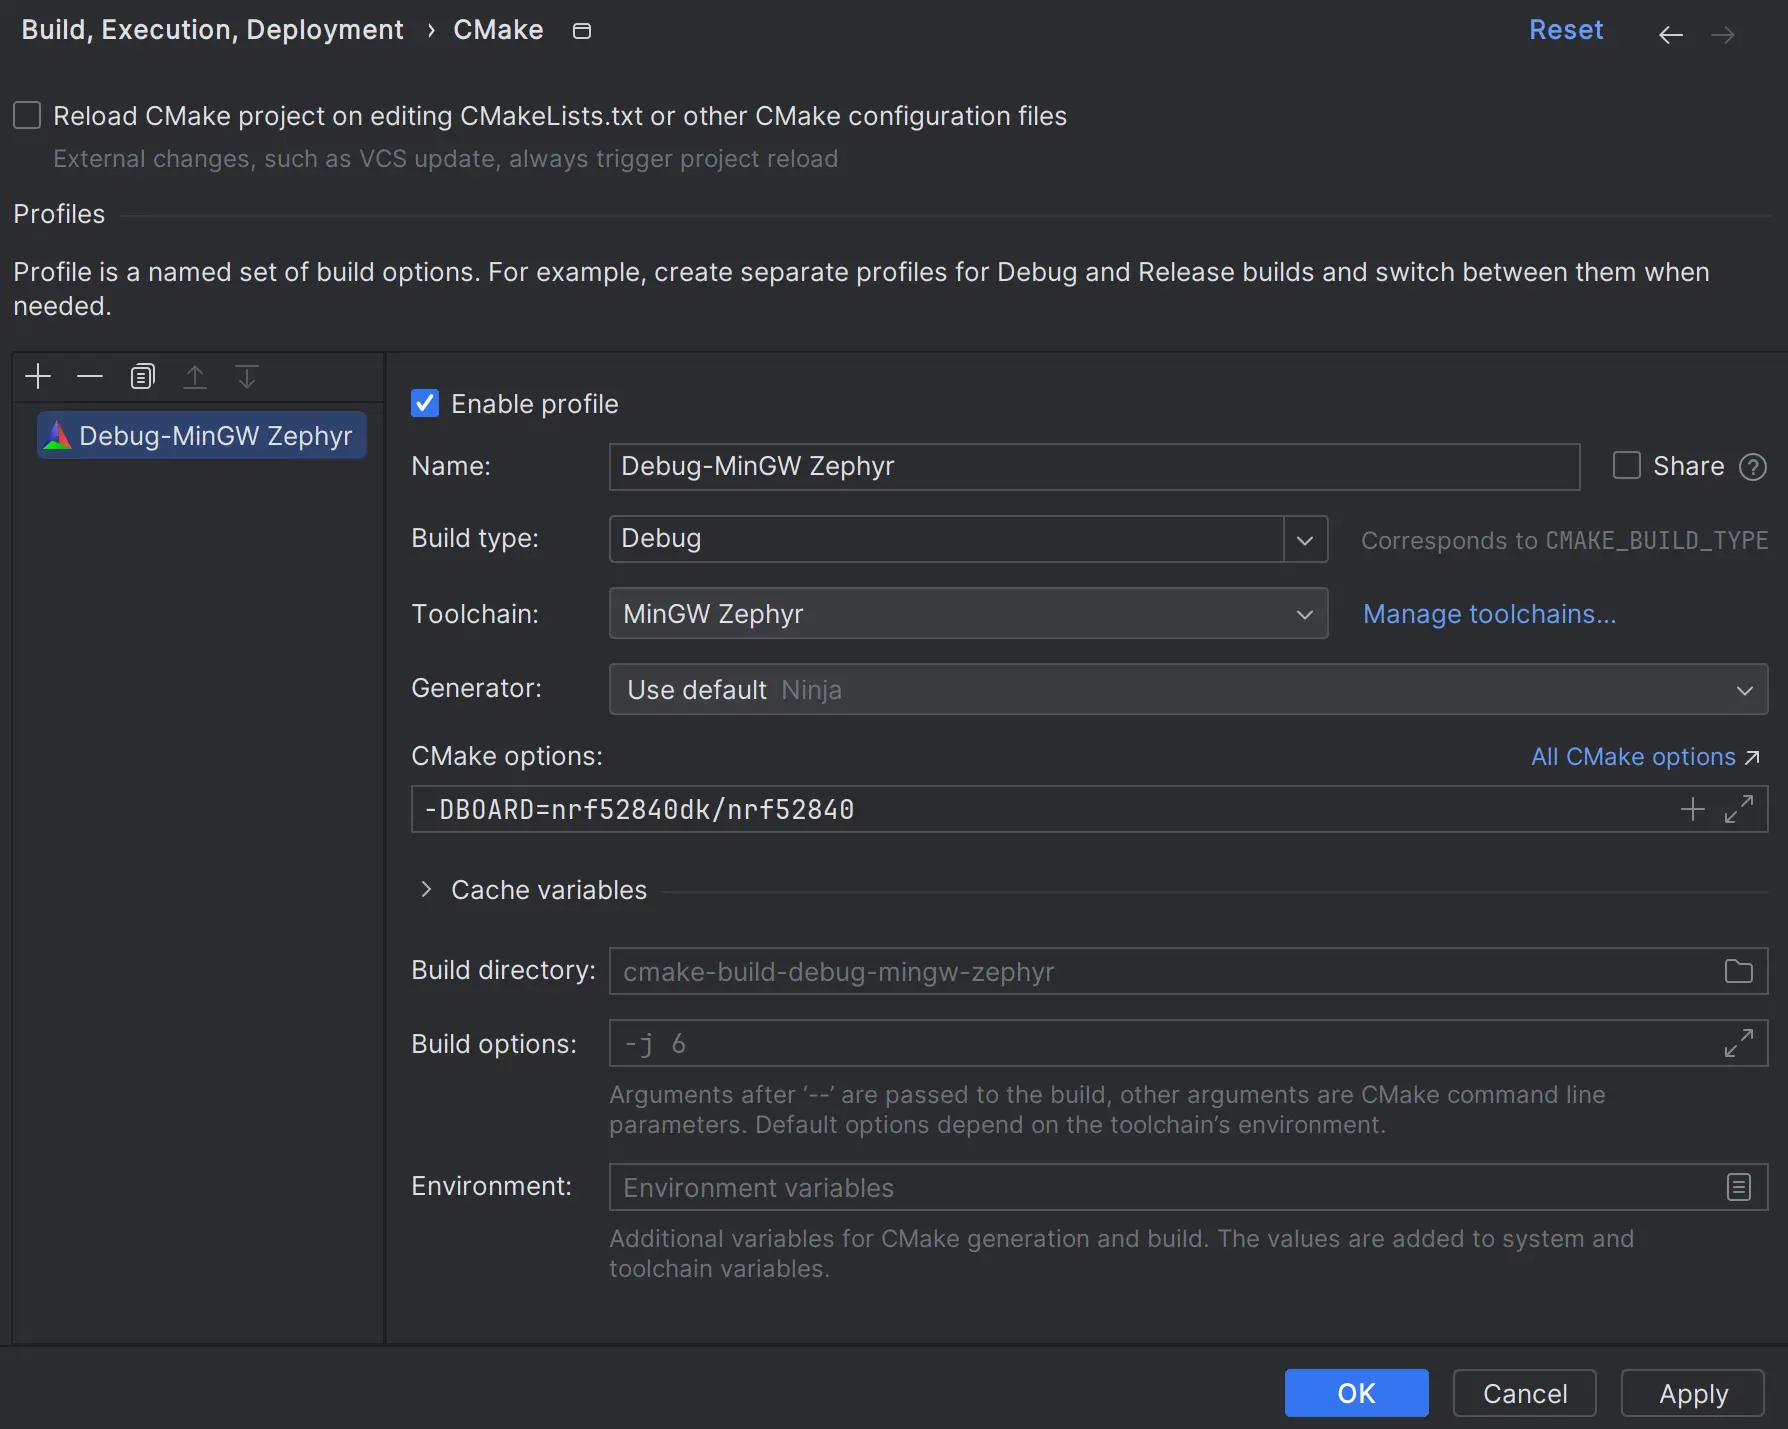
Apply를 누르면 CMake load가 성공적으로 끝나야 합니다.
Debug용 Zephyr parameter 설정
- 오른쪽 위 configuration switcher에서 guiconfig를 선택하고 hammer icon을 누릅니다.
- GUI에서 다음 Kconfig flag를 활성화합니다.
DEBUG_THREAD_INFO
THREAD_RUNTIME_STATS
DEBUG_OPTIMIZATIONSDEBUG_THREAD_INFO는 debugger가 thread 정보를 읽게 하고, THREAD_RUNTIME_STATS는 runtime 통계를 제공하며, DEBUG_OPTIMIZATIONS는 debug에 적합한 optimization 동작을 선택합니다.
Project build
Configuration switcher에서 zephyr_final을 선택하고 hammer icon을 누릅니다. 이 시점에 puncover나 hardenconfig 같은 다른 CMake target도 실행할 수 있습니다.
RTOS integration 활성화
- Settings → Build, Execution, Deployment → Embedded Development → RTOS Integration으로 이동합니다.
- Enable RTOS Integration checkbox를 켭니다.
이 기능은 debug 중 Zephyr task view를 제공합니다. 자세한 내용은 Multi-threaded RTOS debug에 있습니다. 설정을 Auto로 두면 CLion이 Zephyr를 자동 감지합니다.
Embedded GDB Server 구성 만들기
CLion에서 Zephyr application을 debug하려면 Embedded GDB Server template으로 run/debug configuration을 만들어야 합니다. 아래 값은 Nordic Semiconductor board와 Segger J-Link probe 예이며 다른 hardware에서는 맞게 변경합니다.
- Main menu에서 Run → New Embedded Configuration을 선택합니다.
- 다음 값을 설정합니다.
| Option | Value |
|---|---|
| Name (선택) | Zephyr-threads |
| GDB Server Type | Segger JLink |
| Location | Windows의 JLinkGDBServerCL.exe 또는 macOS·Linux의 JLinkGDBServer binary path |
| Debugger | Bundled GDB |
| Target | zephyr-final |
| Executable binary | zephyr-final |
| Download binary | Always |
| TCP/IP port | Auto |
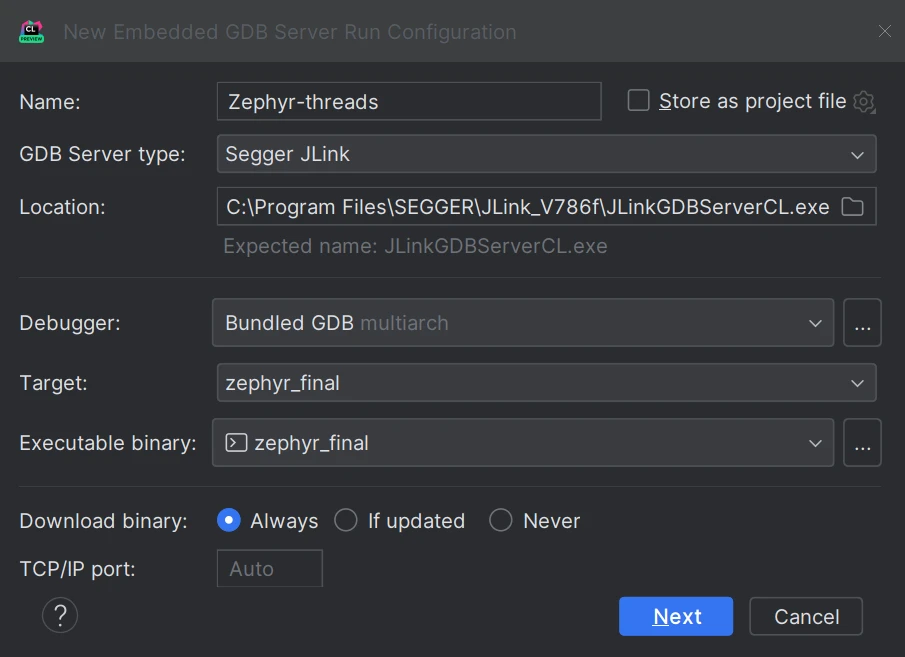
Next를 눌러 Segger J-Link parameter를 지정합니다.
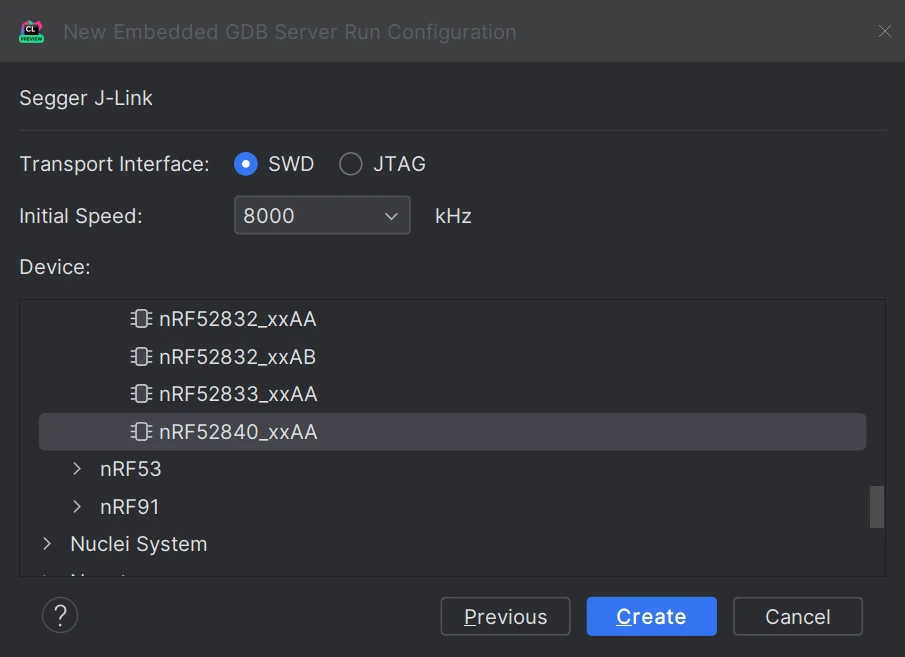
준비가 끝나면 Create를 누릅니다.
Debug 시작
- Code line 왼쪽 gutter를 눌러 breakpoint를 둡니다.
Zephyr-threadsconfiguration이 선택됐는지 확인하고 bug icon을 누르거나Ctrl+D를 누릅니다.- Breakpoint에 도달하면 CLion이 Debug tool window를 엽니다. Threads & Variables pane에서 Zephyr task를 전환하고 각 task의 변수를 조사할 수 있습니다.
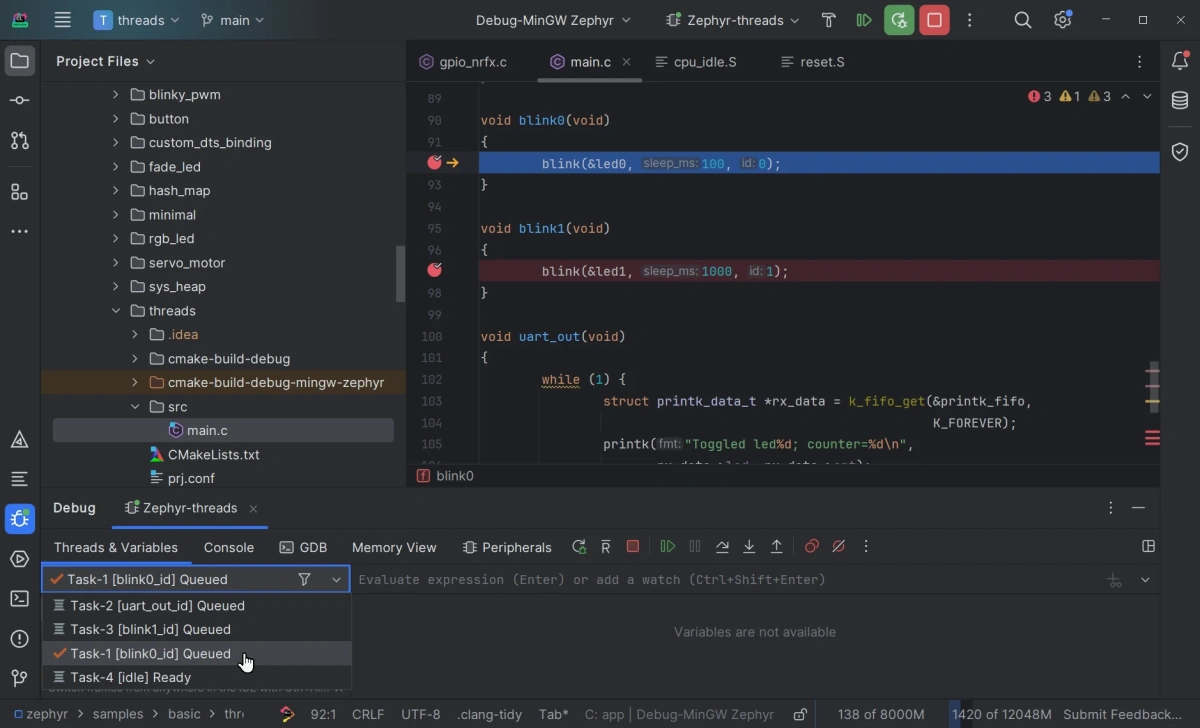
IDE debug 기능 전체는 CLion web help를 참고합니다.
Source
출처
영어 원문에는 문단, 문서 지시문, 표, 코드, 코드 심벌, 경로를 그대로 보존했습니다.